Predictive maintenance for industrial assets

Continuous health monitoring
of critical assets

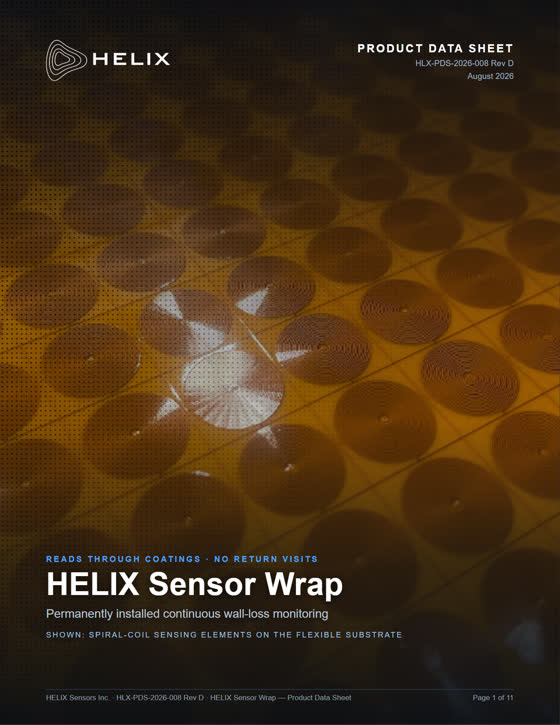
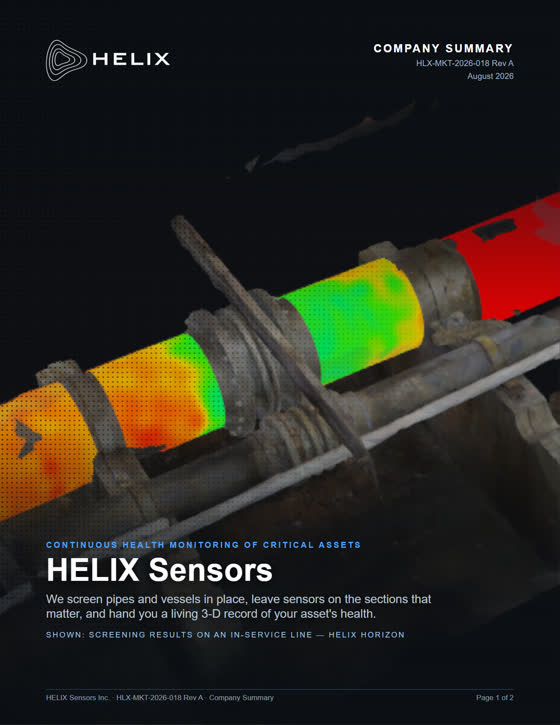
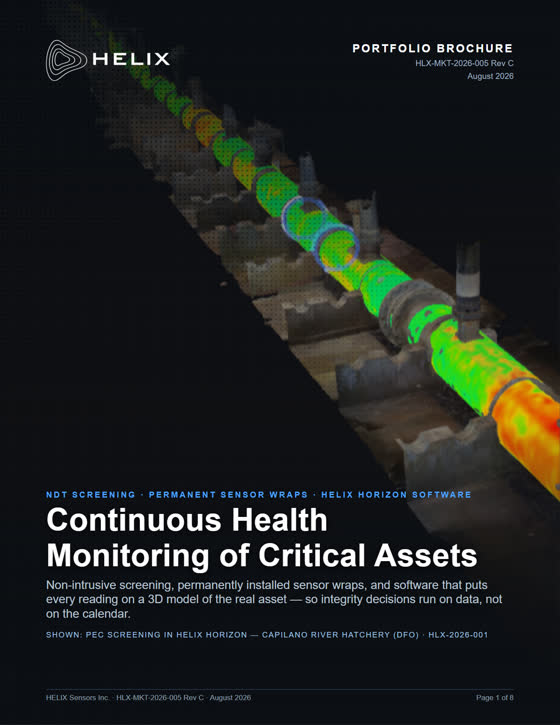
The Helix Sensor Wrap continuously tracks changes in industrial asset material condition, helping maintenance teams detect degradation earlier, understand how it is evolving, and prioritize where to act.

Multiple sensing modes in one hardwareLive asset view

The risk

Material defects can cause plant shutdown at any time.

Corrosion, erosion and cracking do not wait for an inspection window. An inspection gives you a number on the day it was taken, not the rate it is changing or which point is going first. So the next outage stays a possibility instead of a date.

CFD erosion prediction (a) · the real failures (b)Sim + reality
CFD erosion prediction (a) · the real failures (b)Published CFD study

Helix monitors the entire asset continuously.

With Helix

Enabling predictive maintenance.

The wrap reads wall thickness continuously. With months of history at every monitored point, we run it forward: where the wall is heading, how fast, and how confident the projection is.

Wall thickness · forecasted

ILLUSTRATIVE · MONITORED POINT P-07 · 6-MONTH PROJECTION

8.68.89.09.29.49.6mm-12 mo-6 motoday+6 moMIN ALLOWABLE 8.85 mm9.19 mmFORECAST →RATE CHANGE

How
HELIX
Works

Step 1

We wrap once.

One install, no shutdown, no access work to book again. The wrap goes on and stays on.

Proved in the field

Field record.

3,200+

ft² of scanned area

2,000h

Hours of wrapped scan time · live

360M+

industrial data points collected

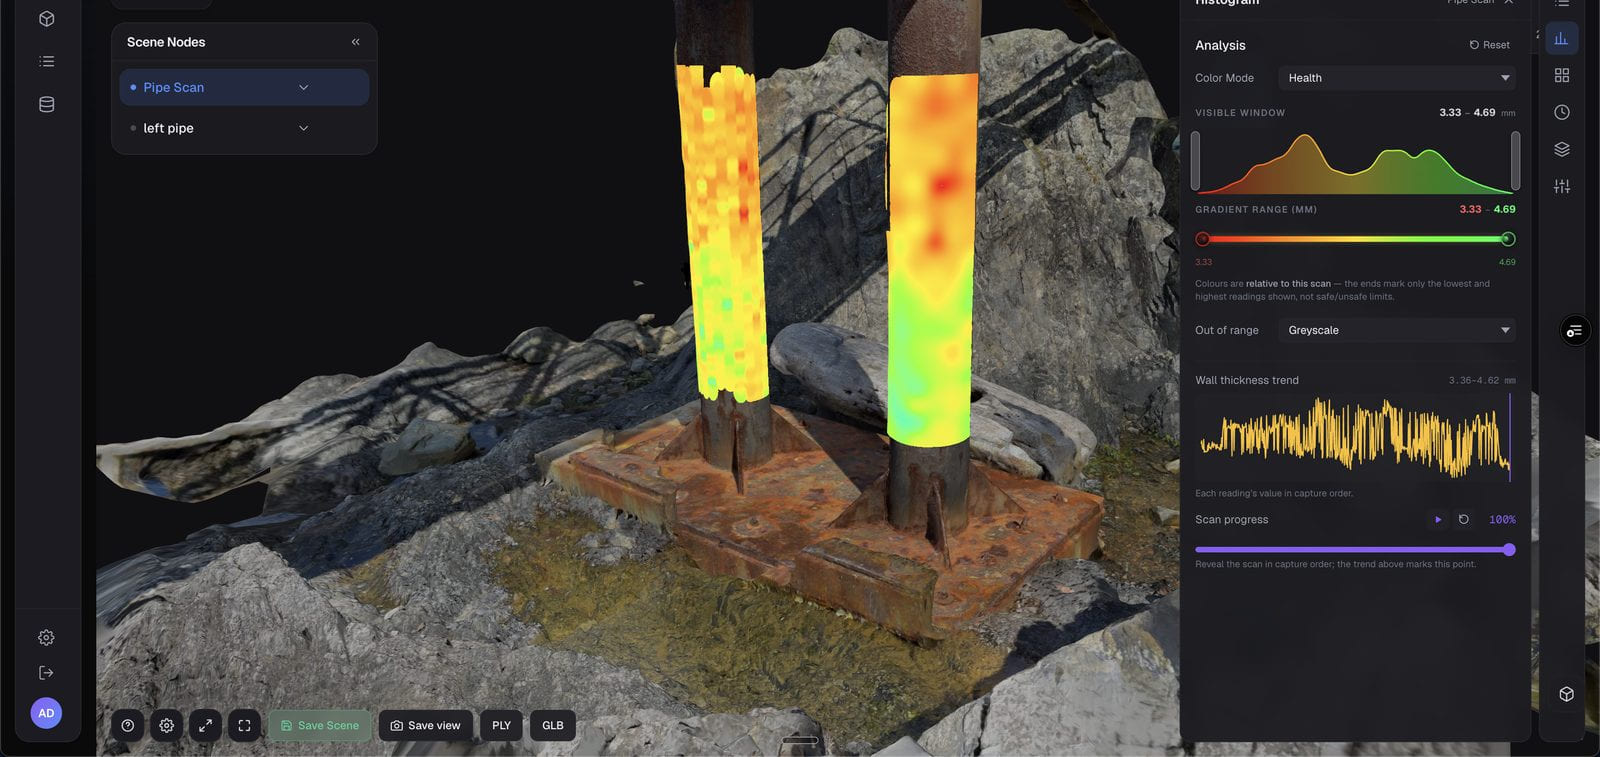
The Helix asset viewer showing two rusted riser pipes with live wall-thickness heat maps, histogram and trend panel.
Live asset viewer · twin risers, wall-thickness field
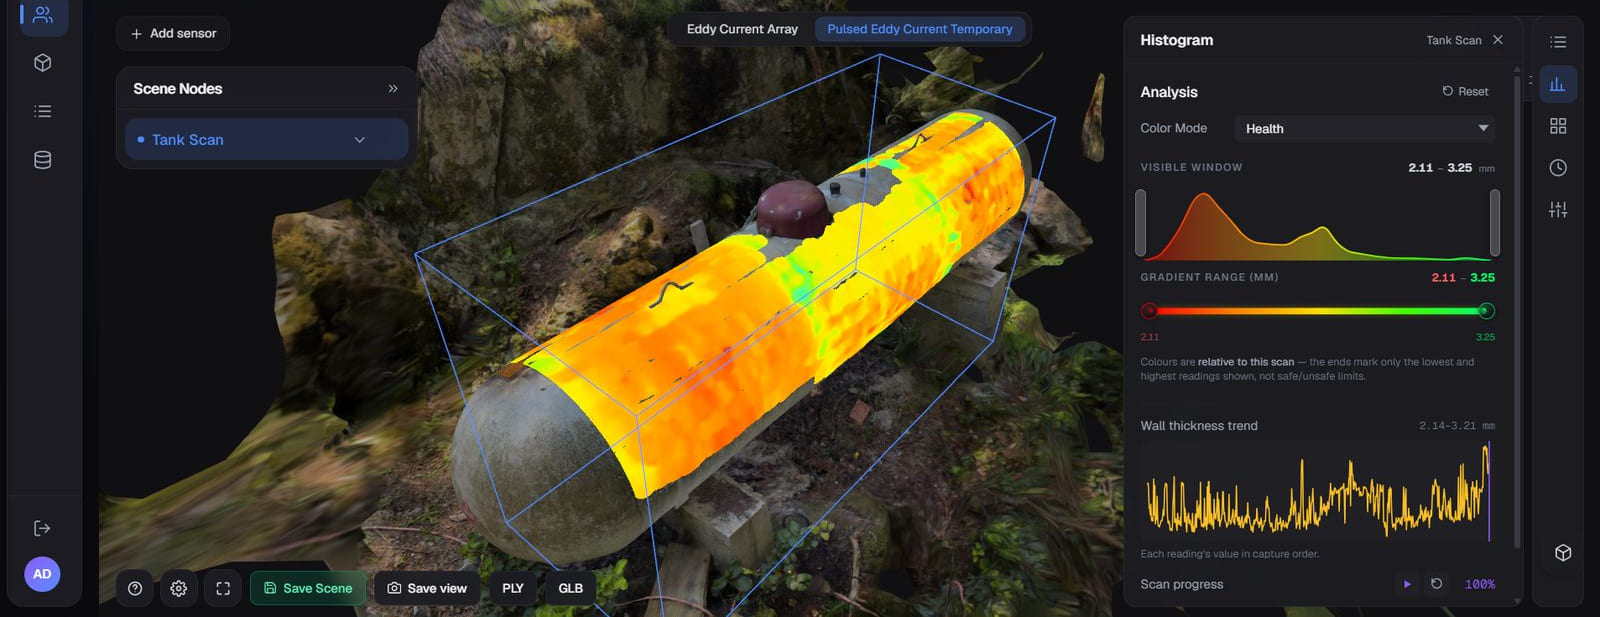
The Helix asset viewer showing a propane tank scan coloured by wall thickness, with eddy-current and pulsed-eddy-current layers.
Propane tank · pulsed eddy current scan
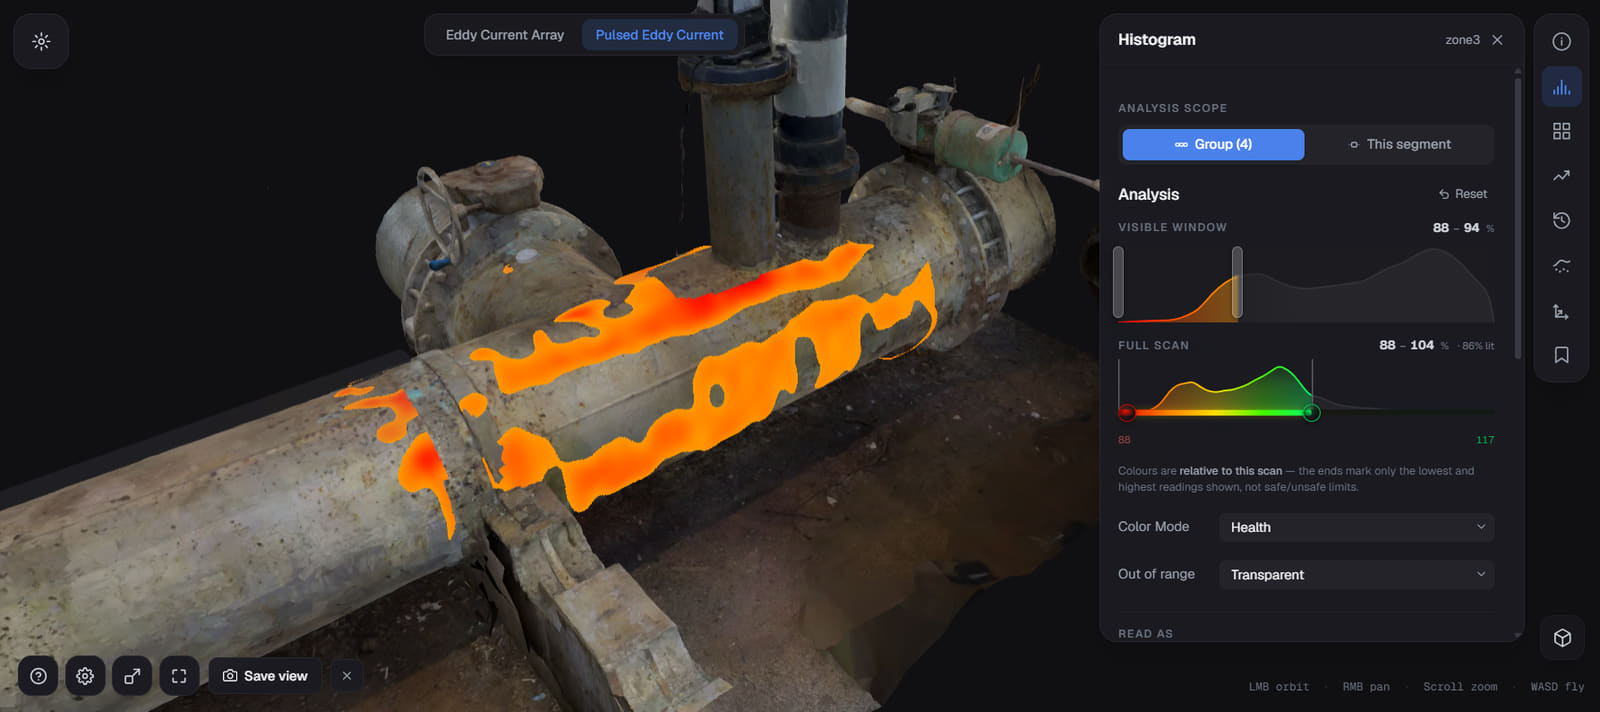
The Helix asset viewer with every reading above 94% wall hidden, leaving an orange band of thinned metal running the length of a scanned spool between two flanges, against a scan range of 88 to 104% wall.
DFO pipeline · wall loss below 94% of scan
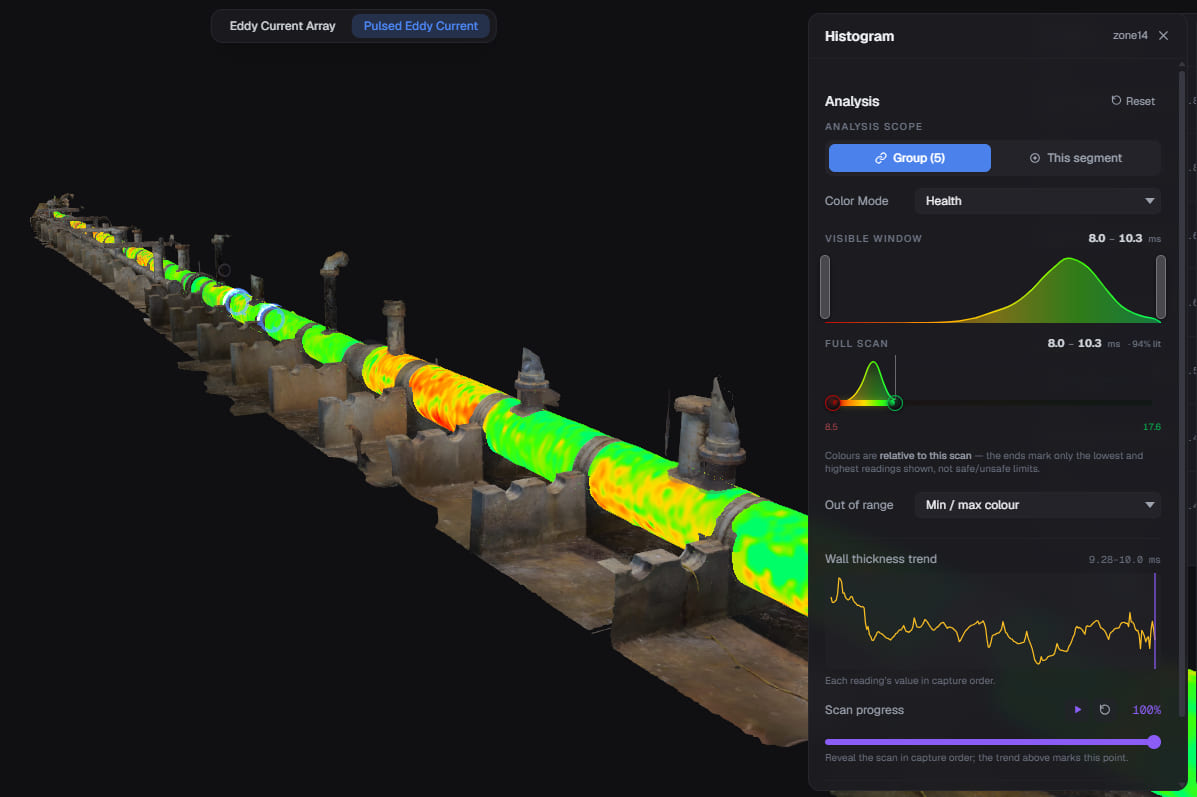
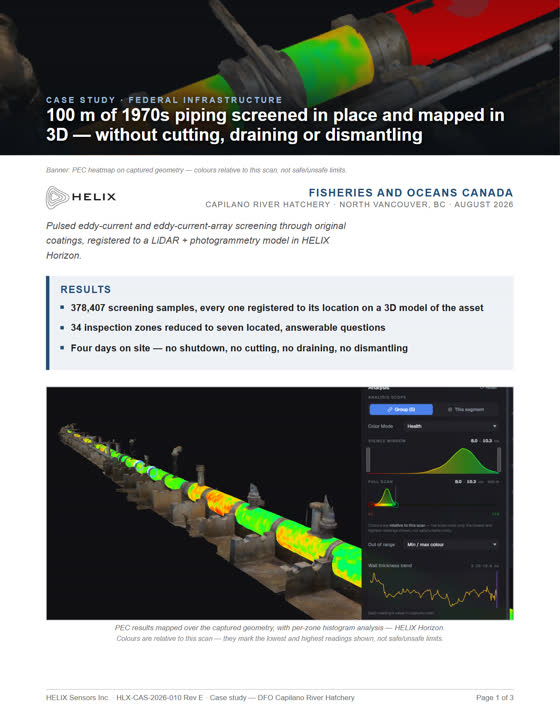
The Helix asset viewer showing the DFO line coloured by pulsed-eddy-current wall thickness over a 8.0 to 10.3 millisecond window, beside the histogram and the wall-thickness trend plotted in capture order.
DFO pipeline · wall-thickness trend in capture order

The business case

Where the value
comes from.

You already pay for not knowing: inspection campaigns, conservative operating limits, early replacements, and the failure that finds you first. Continuous data flips every one of those.

Throughput

Throughput optimization

Support operating decisions with continuous condition data rather than conservative assumptions.

Failure risk

Risk reduction

Degradation seen as a trend, so repairs can be planned rather than forced.

Inspection cost

Inspection cost displacement

Reduce the frequency and scope of selected inspection activities, including recurring access work.

Replacement capex

Deferred replacement capex

Measured degradation rates justify safely running the asset longer.

Safety exposure

Safety exposure

At-height and confined-space inspection hours come off the books.

The business case

Book a call today for an ROI model with your numbers.

We build it live on the call: what you would save on inspection campaigns, throughput and deferred replacements, and the risk you are carrying between inspections today.

In most models the inspection savings alone carry the case. Everything after that is upside.