
Case studies

Proof from
the field.

The first study is below, with the operator's name on it. More are being written up as each one clears review.

Fisheries and Oceans Canada

Government · Marine infrastructure

Case study 01

A recommissioning decision, made on measured wall.

A length of out-of-service pipeline had to be judged fit to return to duty. The question was not whether the line looked acceptable, it was whether anyone could put numbers on what the wall had left and whether cracking had started. Without that, the safe answer is always to replace.
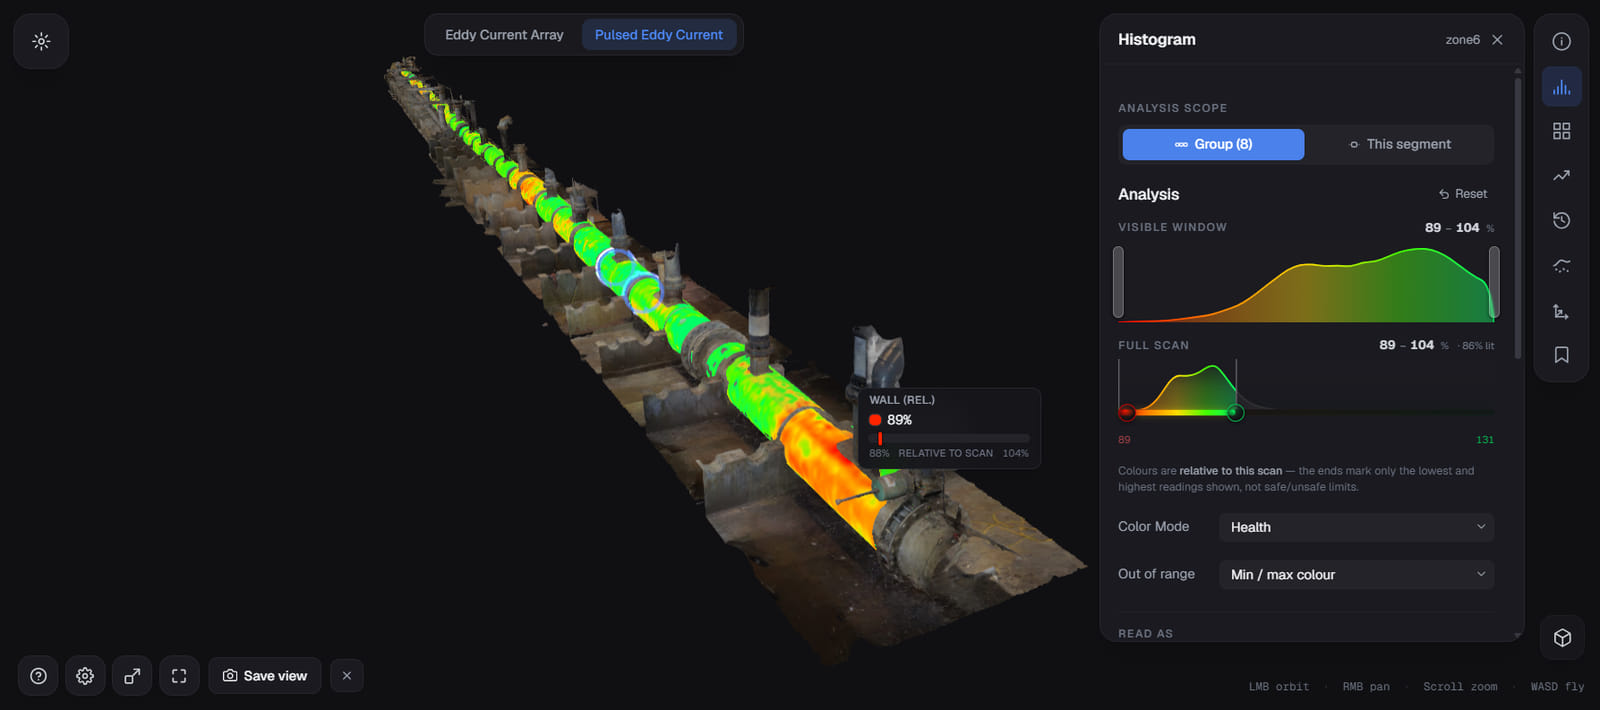
Helix asset viewer: the monitored length of pipe coloured by pulsed-eddy-current wall reading, green over most of the run and orange over a thinned section near the far flange, with a hovered point reading 89% wall relative to the scan.
Pulsed eddy current · wall across the monitored length
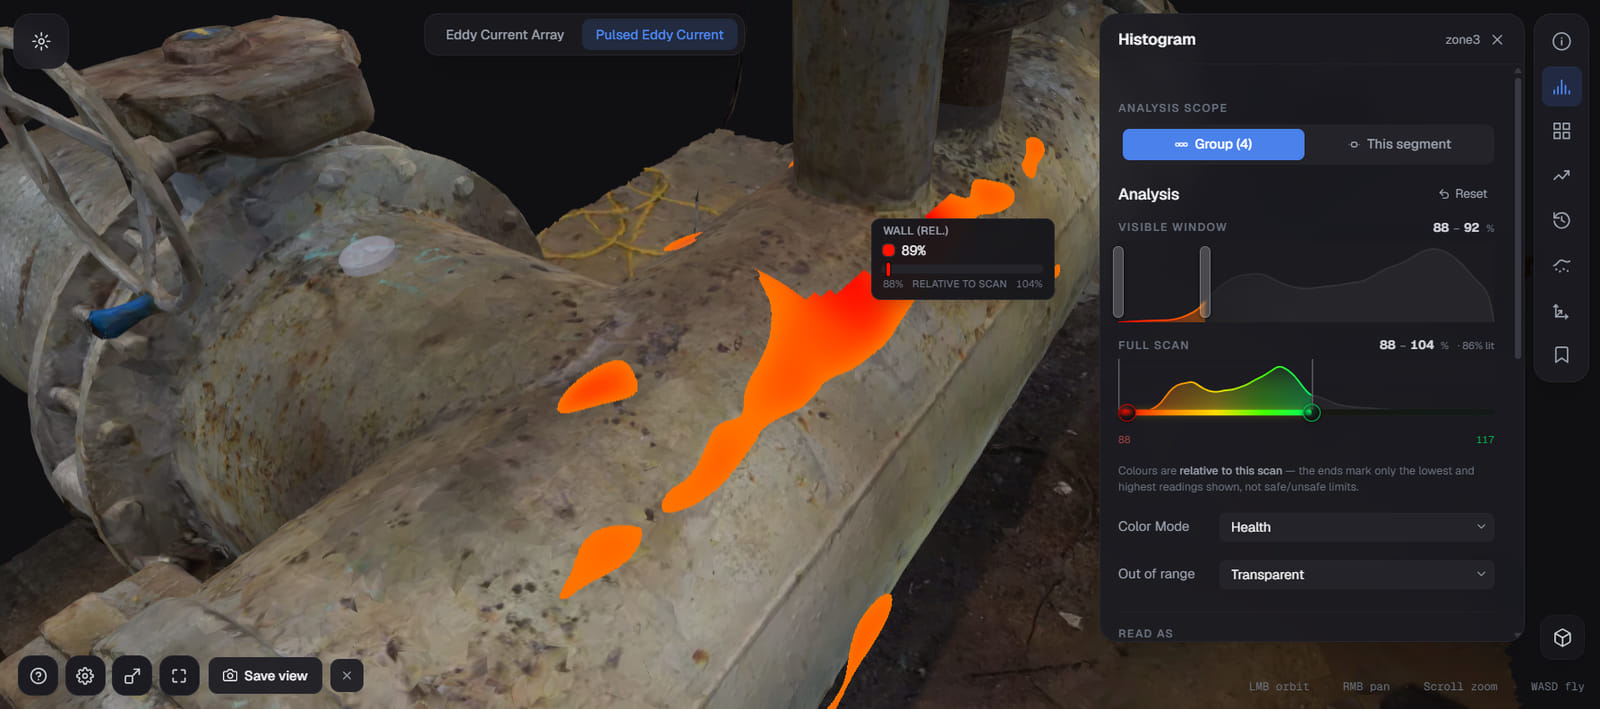
The same line with every reading above 92% wall hidden, so only the thinned metal is drawn: orange patches tracking along the crown of the pipe, the largest reading 89% wall against a scan range of 88 to 104%.
Wall loss isolated · everything above 92% hidden
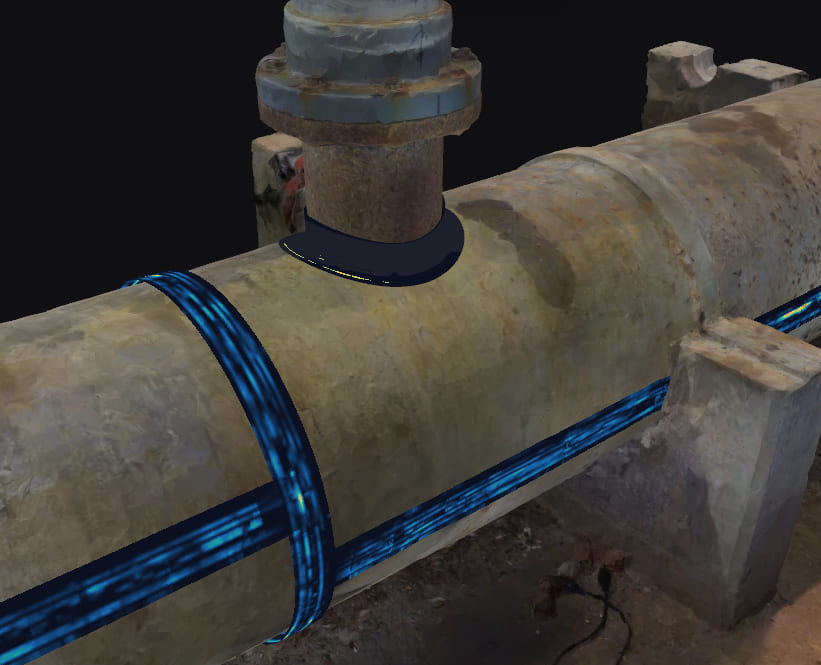
Eddy-current-array response mapped along a branch-nozzle weld and the circumferential welds either side of it, drawn as bright bands that brighten where the array signal rises across the weld line.
Eddy-current array · nozzle and weld lines
The question
Recommission the existing line, or run a new one. Fifty metres of 24-inch pipe either way.
What we read
Wall thickness across the monitored length, and hairline-crack indications from the eddy-current array.
What it enabled
DFO's maintenance engineers made the recommissioning call on measured condition rather than assumption.
What it avoided
The cost of laying a replacement line: 50 m of 24-inch pipe, plus the install and the downtime around it.
Request the full write-up

Scan data and the wall-thickness map are shared on request, with the operator's clearance.

Also deployed in

Mining and bulk handlingPipeline and energyPulp and chemical process

These operators are named once each write-up is cleared for publication.

01

The asset and the risk

What the section carries, what failure would have cost, and why periodic inspection was not enough on its own.

02

What the wrap read

Which sensing modes were installed, what they picked up, and the first sign that showed up in the data.

03

The forecast against reality

The growth rate we projected, the date we put on it, and how the asset actually behaved afterward.

04

What it changed

The inspection campaign avoided, the shutdown planned instead of forced, and the numbers behind both.

Your asset

Want the closest study to your asset class?

Tell us what you are trying to decide and we will send the study nearest to it, along with the raw scan if the operator has cleared it.